1. Comparative Summary of NMK5 SUMPS
Incorporating the needs of minority groups and disadvantaged populations is not optional—it’s foundational to building cities that are sustainable, just, and resilient. Without this focus, urban mobility systems risk reinforcing inequality rather than dismantling it. Resilience in urban mobility isn’t just about bouncing back—it’s about building forward. It enables cities to remain functional, fair, and sustainable in the face of growing uncertainty. Without it, progress toward inclusive, green, and efficient transport systems is fragile and at constant risk. Therefore it is important to focus on the transport needs for the vulnerable groups like elderly people, disabled people and women.
The locations, areas, number of settlements and population density is given in the figure below.
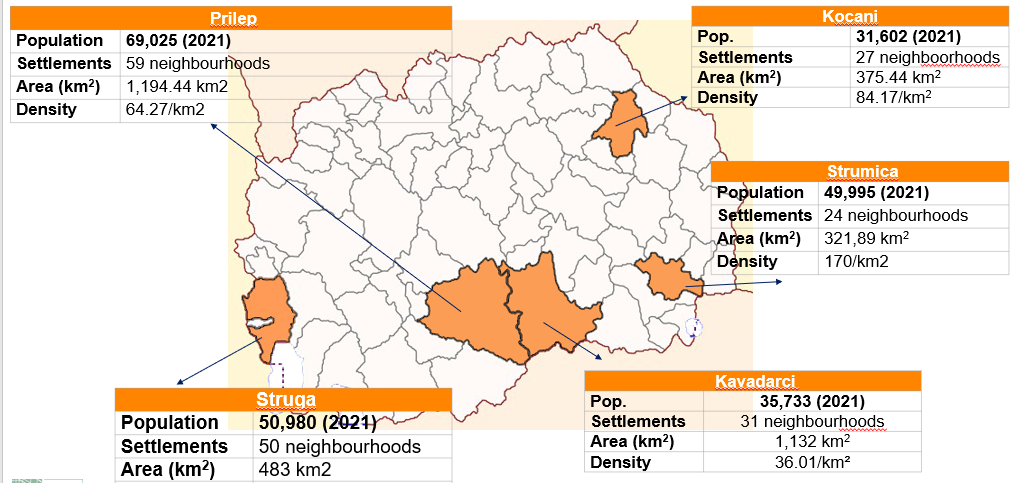
1.1 SocioDemographic Structure
In the table below the population structure of the cities are given. As seen from the table, the largest hosehold size and the largest rural population is in Struga. On the other hand, the most crowded city is Prilep and the smallest one is Kochani. Considering the sociodemographic structure working population rate is the highest in Kavadarci.
Population Related Information:
Table 1. Population Structure
| City | Population | Household Size | Urban Pop | Rural Pop |
|---|---|---|---|---|
| Kavadarci | 35,733 | 2.89 | 90.0% | 10.0% |
| Struga | 50,980 | 3.49 | 29.5% | 70.5% |
| Strumica | 45,955 | 2.87 | 68.0% | 32.0% |
| Kocani | 31,602 | 2.63 | 78.0% | 22.0% |
| Prilep | 69,025 | 2.81 | 91.7% | 8.3% |
Table 2. Sociodemographic Structure
| City | Population | Working Pop Rate | Disability Status | Literacy Rate |
|---|---|---|---|---|
| Kavadarci | 35,733 | 42.4% | 4.9% | 96.7% |
| Struga | 50,980 | 38.7% | 4.2% | 96.1% |
| Strumica | 45,955 | 35.2% | 3.2% | 89.6% |
| Kocani | 31,602 | 36.6% | 5.6% | 95.3% |
| Prilep | 69,025 | 36.0% | 7.4% | 95.5% |
Strumica
Kocani
Struga
Kavadarci
Prilep
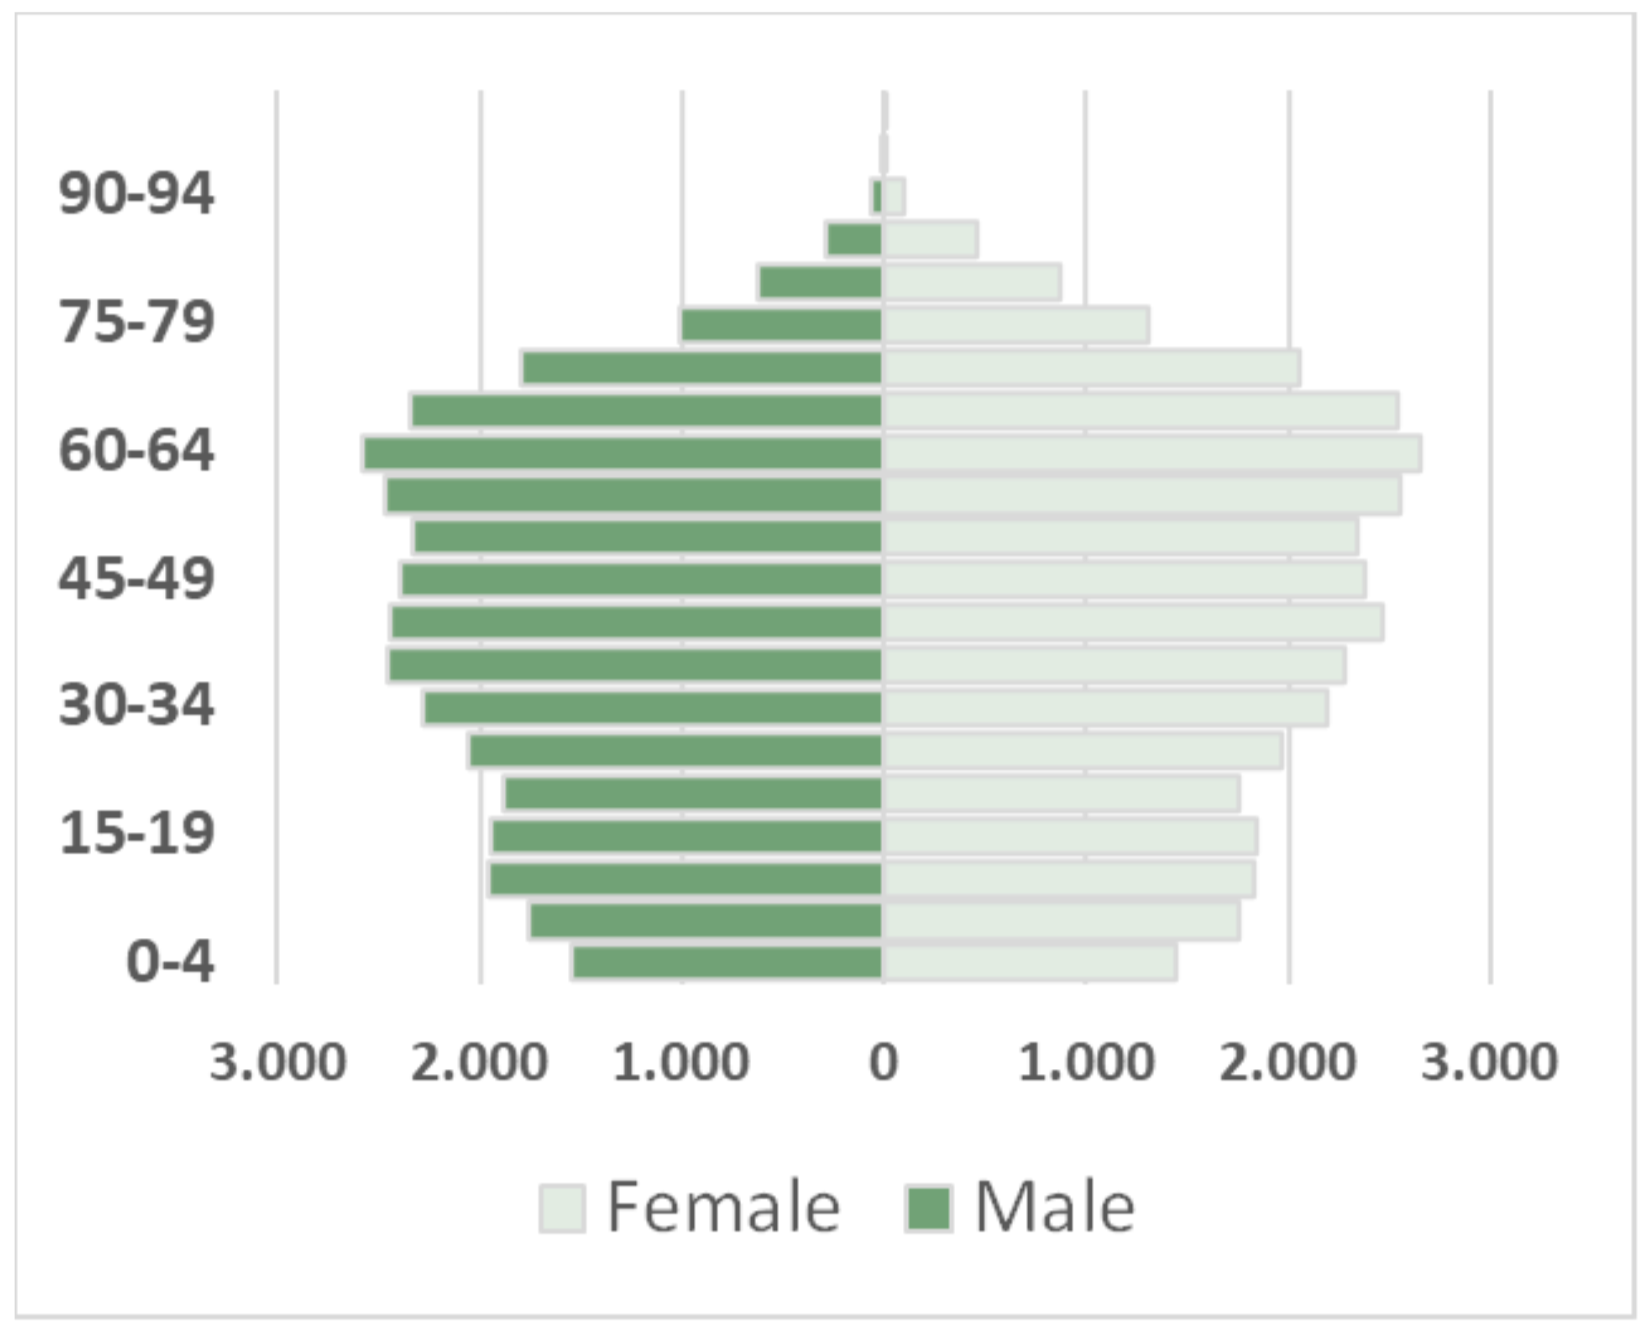
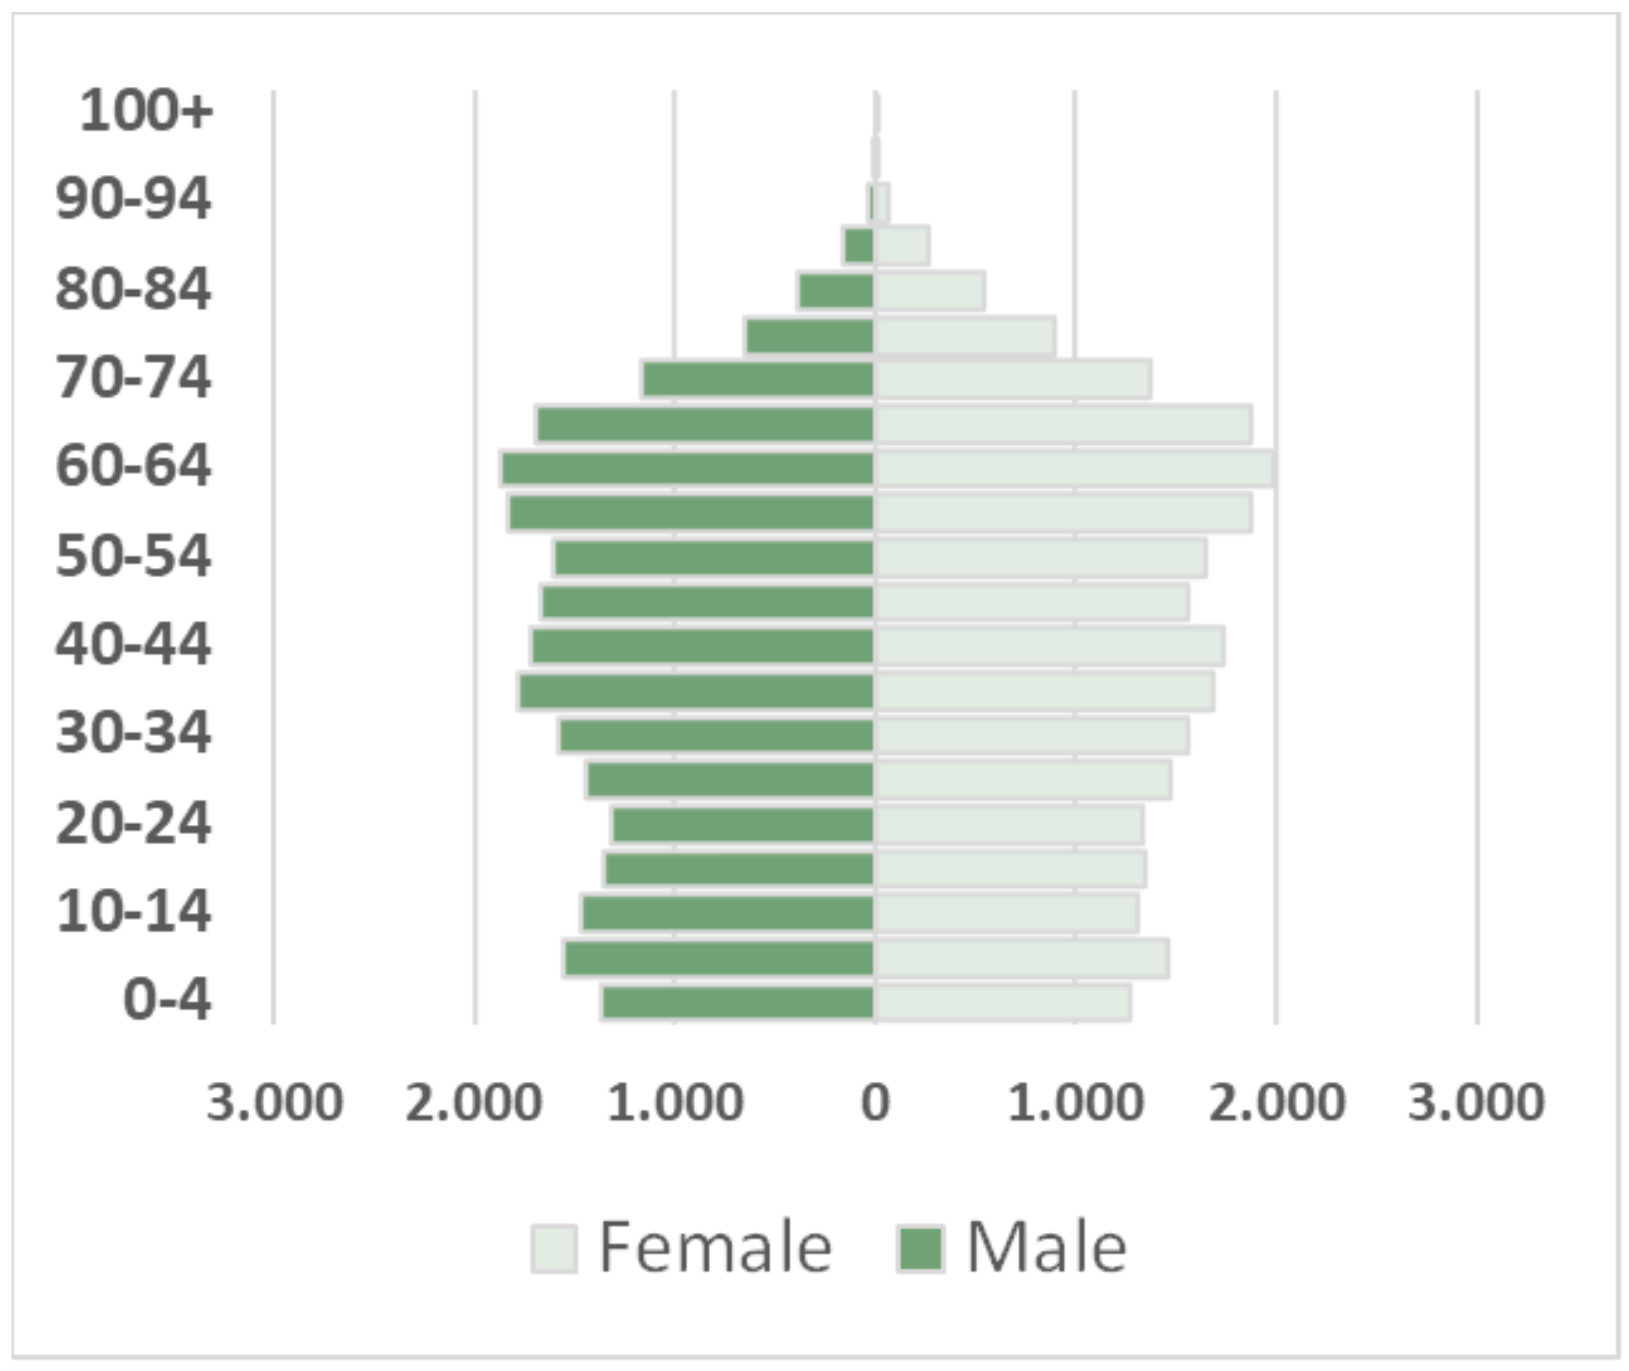
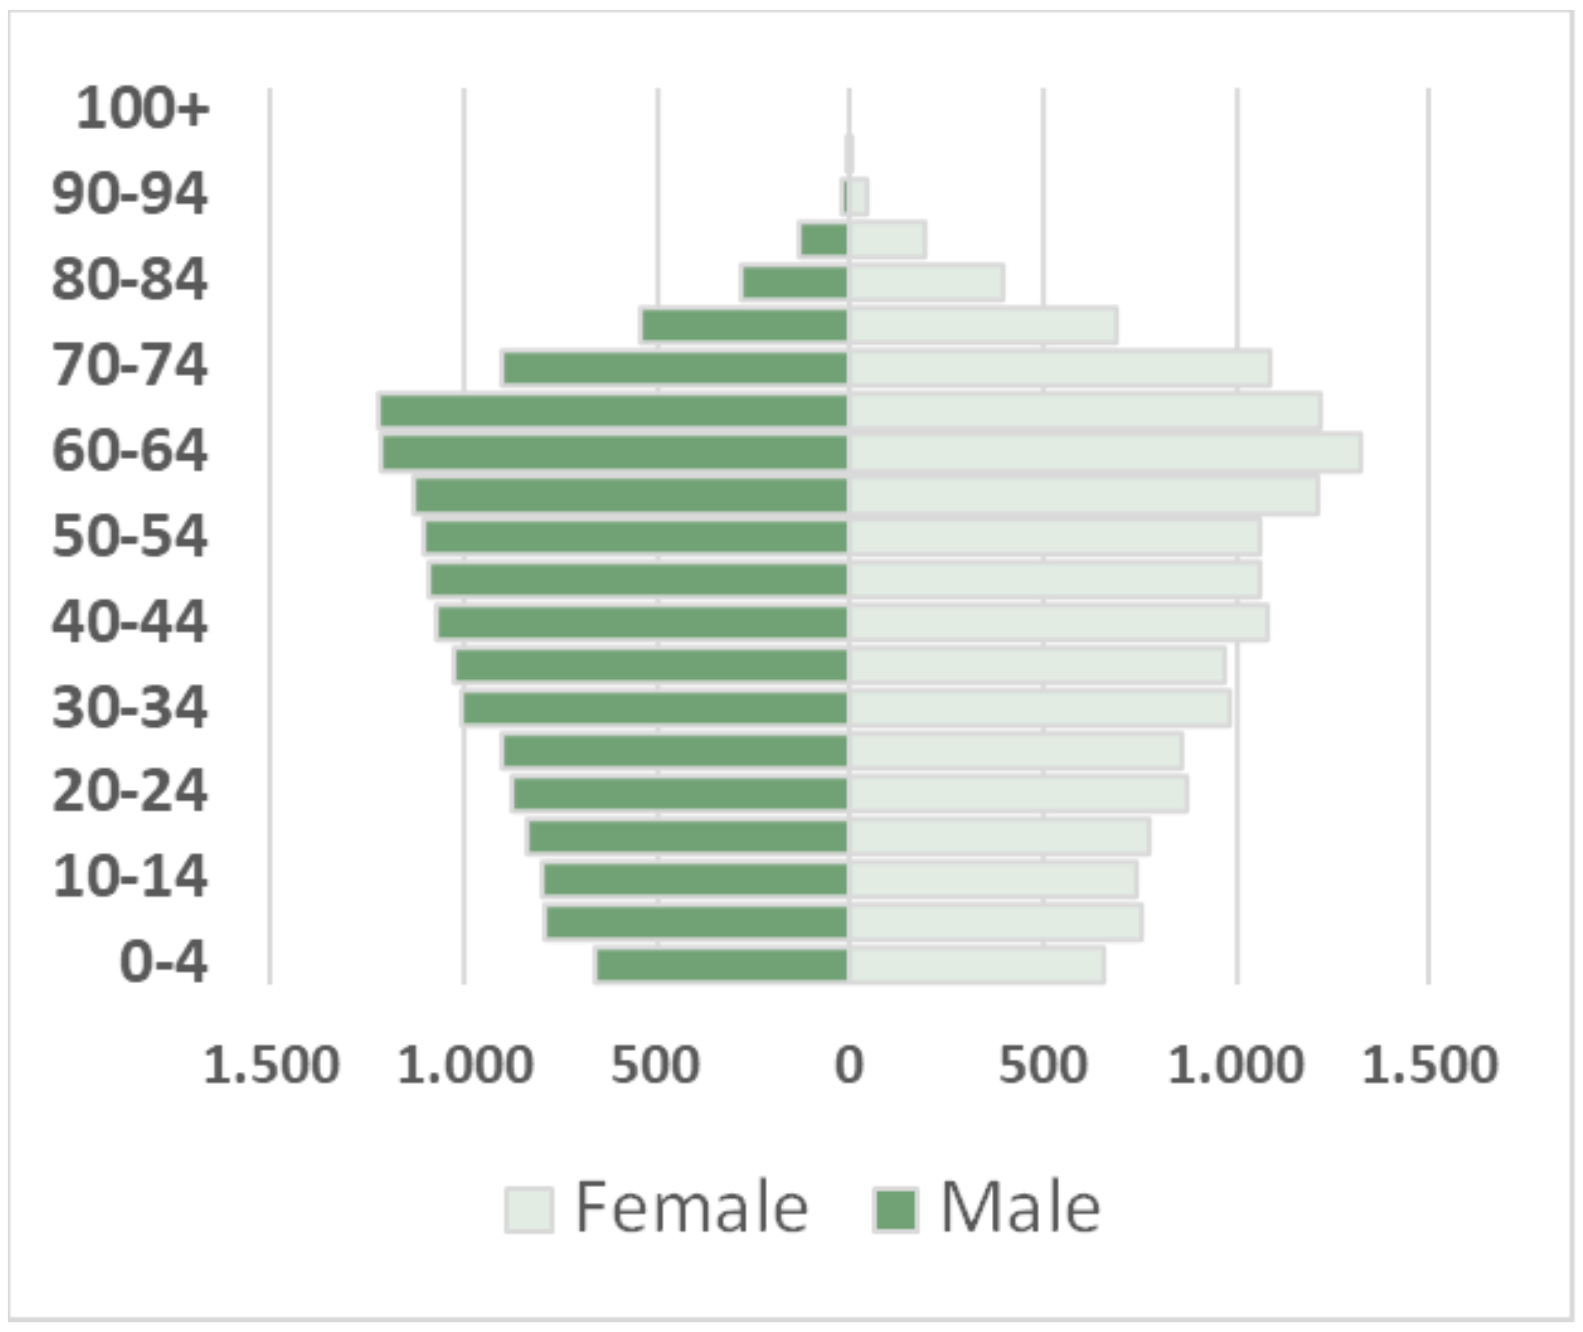
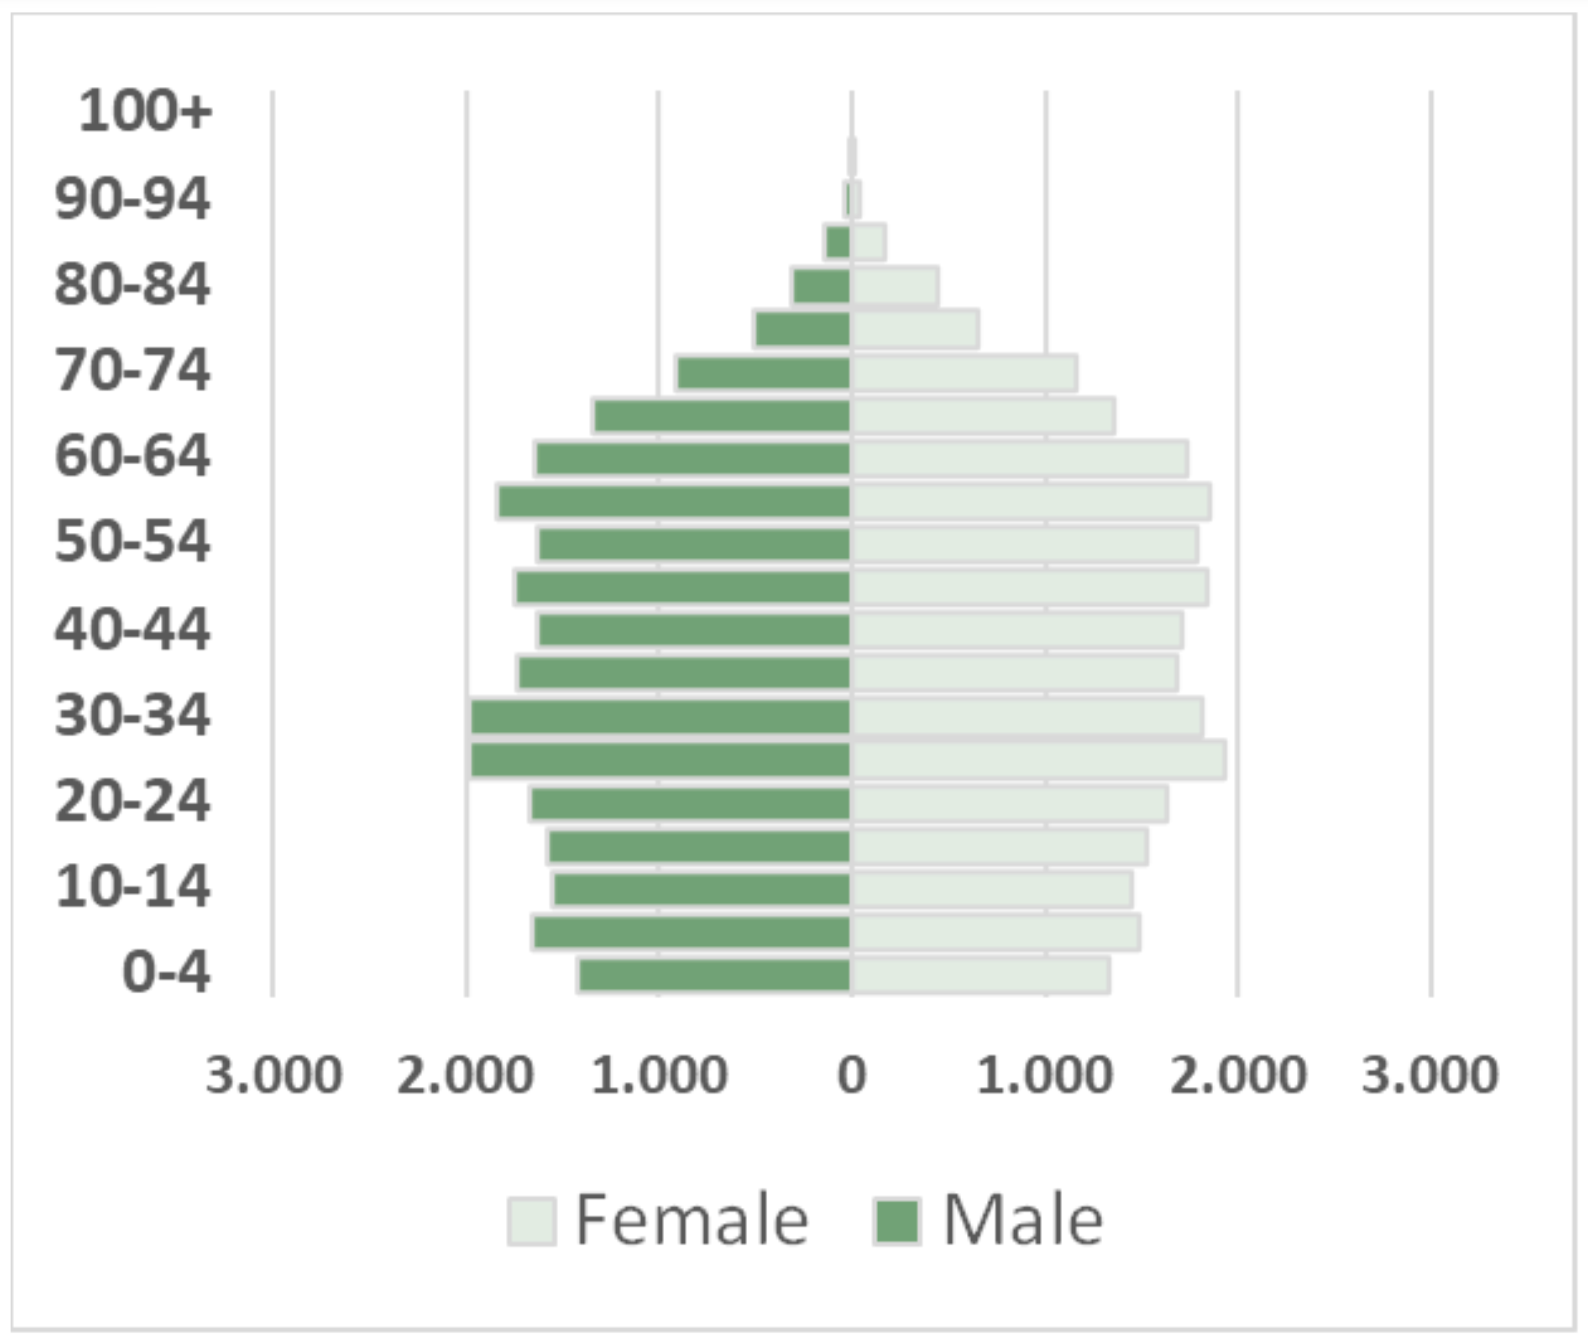
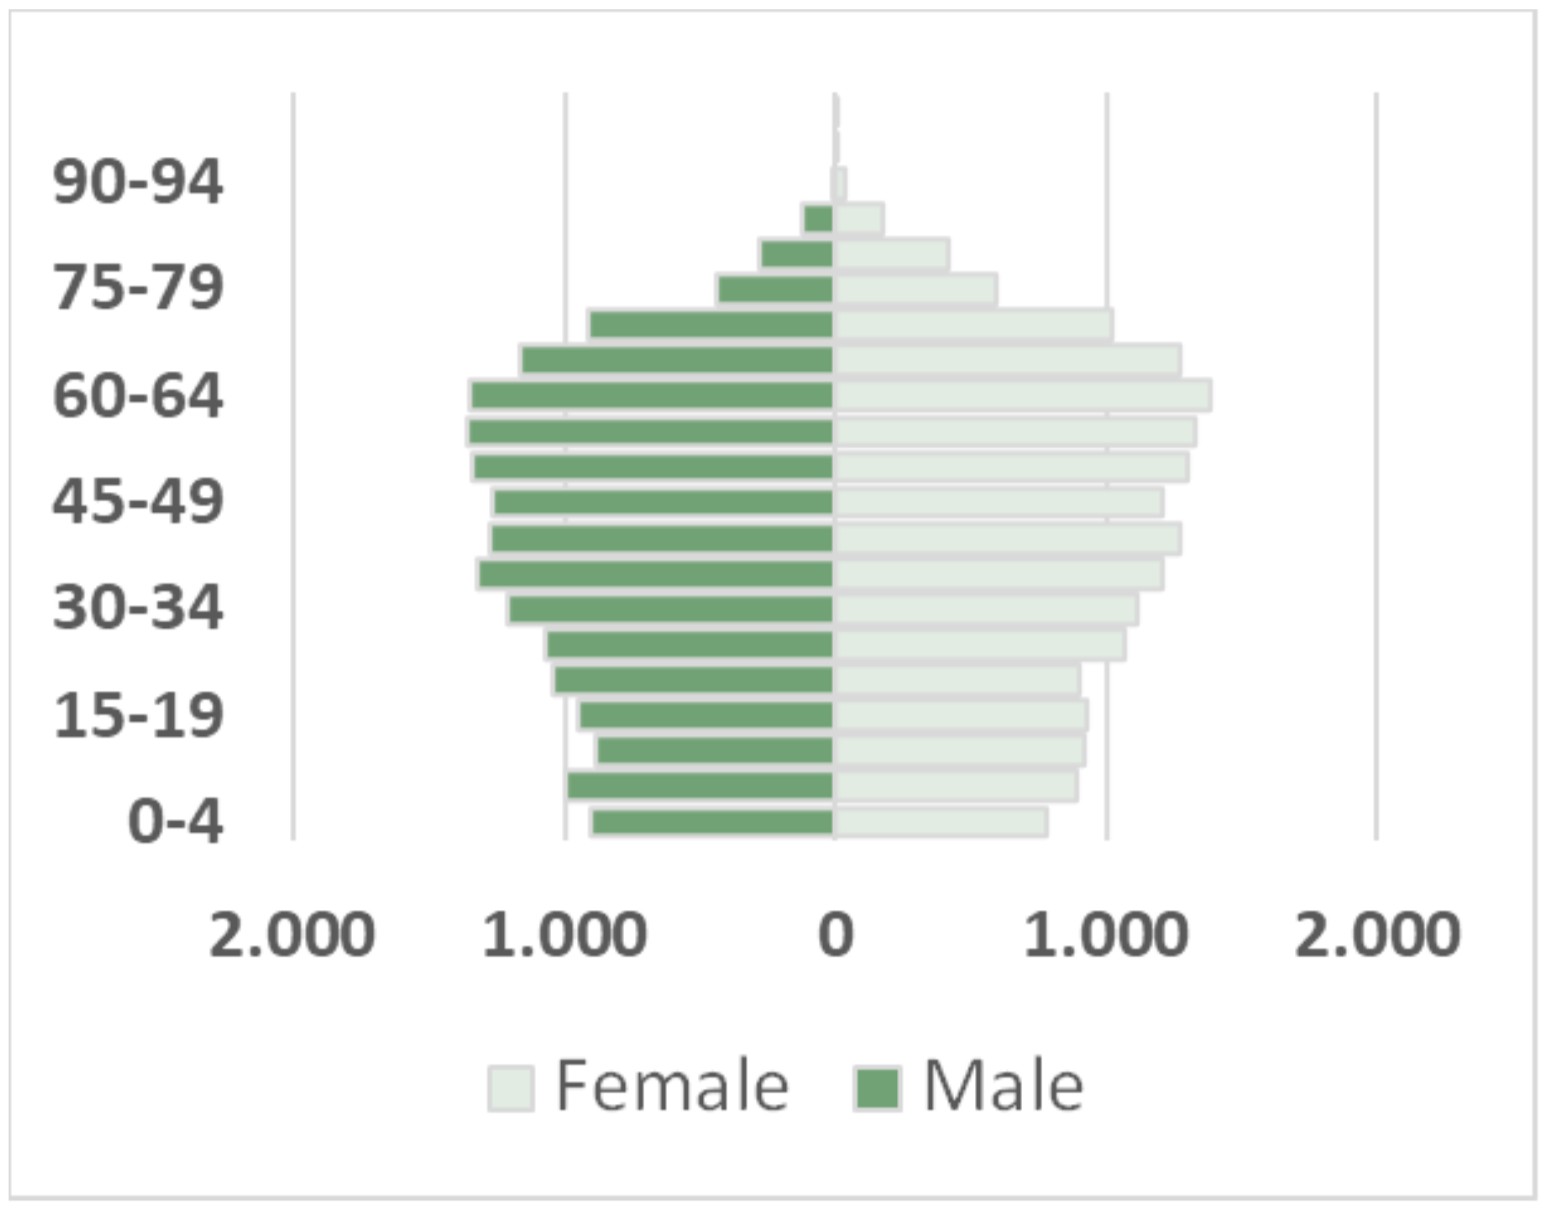
Population Pyrmamids for 5 cities are given. When analysing the population structure it can be evaluated that Struga has the youngest population among these cities. Strumica is the one following Struga on this topic. Rest of the cities have a large amount of elderly population which is an important thing to take into consideration while producing strategies and measures about the transportation needs of the citizens.
The gender distribution of the population is similar for all the cities.
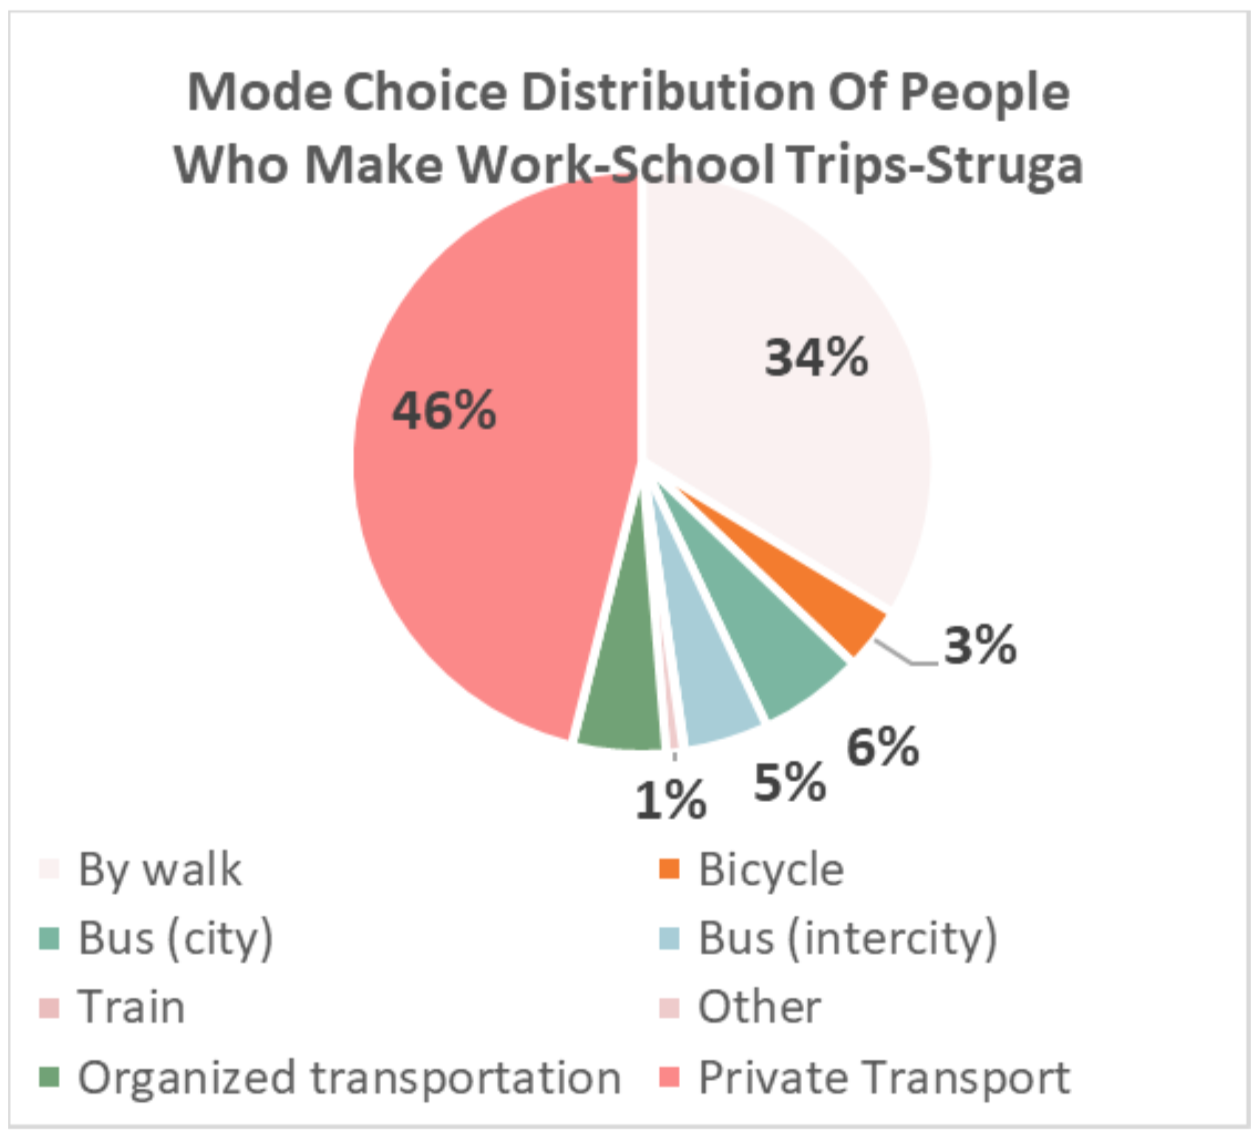
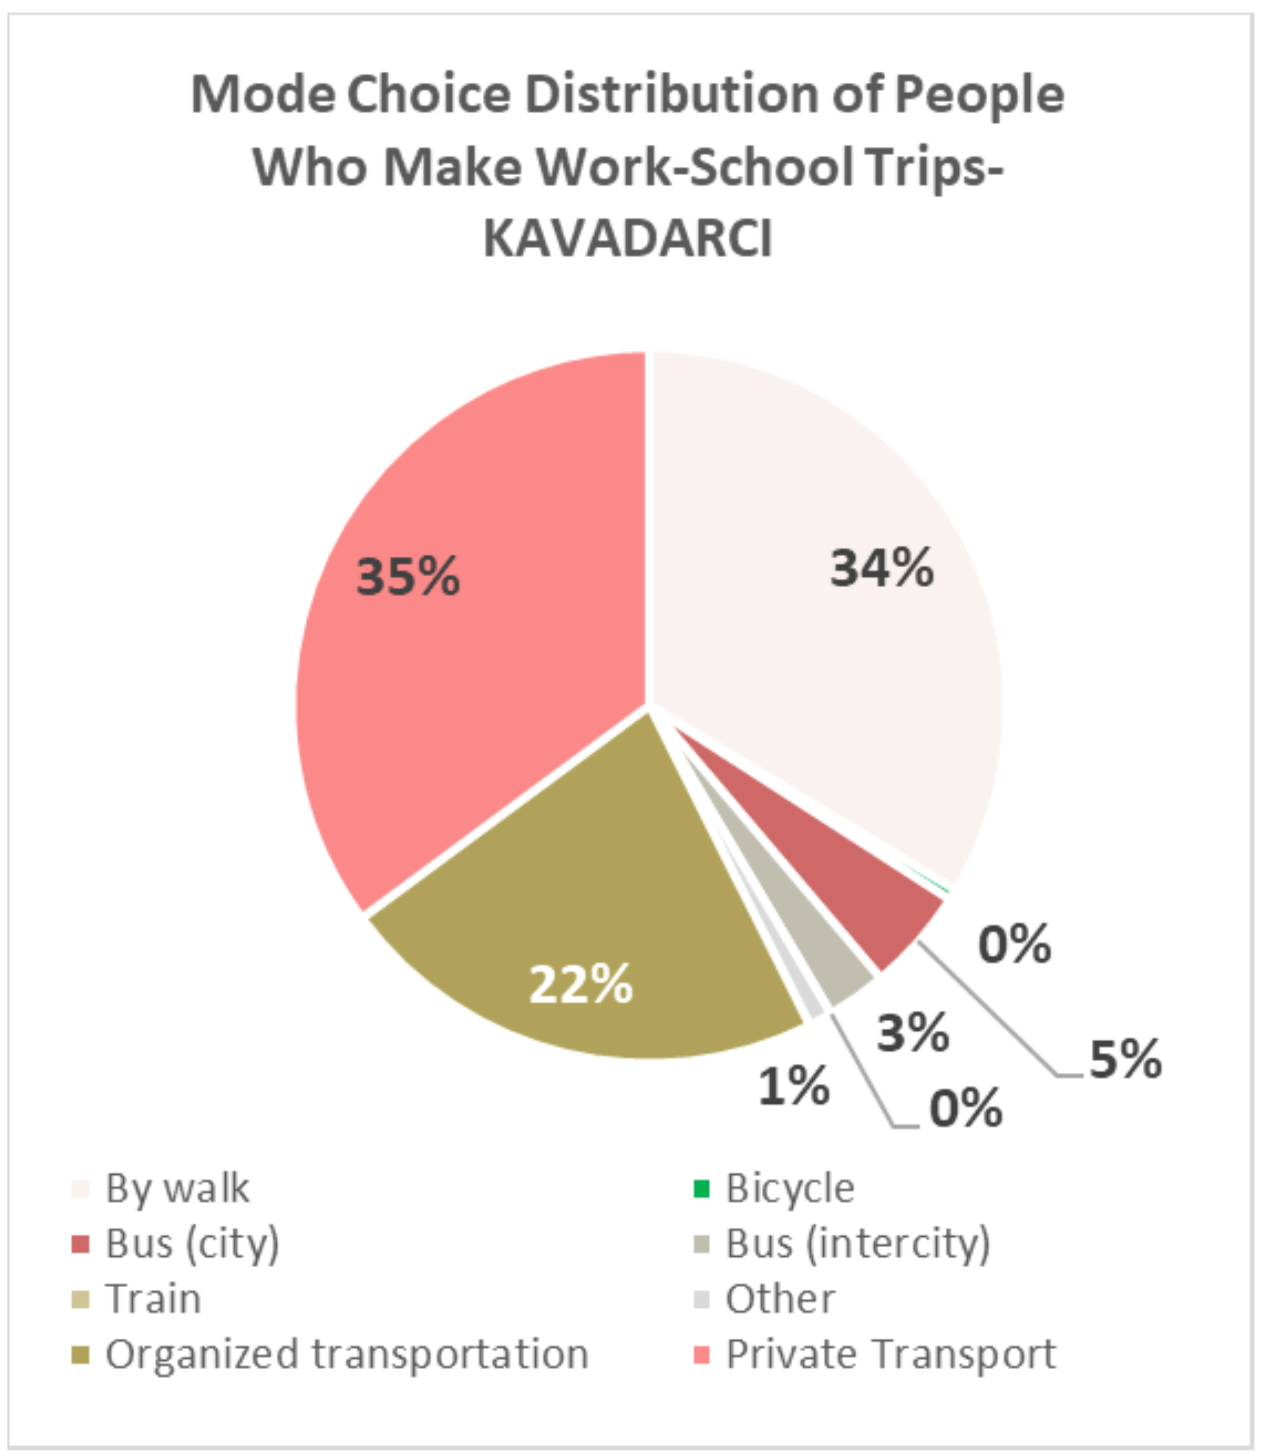
1.2 Modal Split Analysis and Comparison
Struga (Pop: 50.980): A popular tourist destination on Lake Ohrid, improved mobility will boost tourism, enhance public safety, and ensure sustainable growth.
Strumica
Kocani
Struga
Kavadarci
Prilep
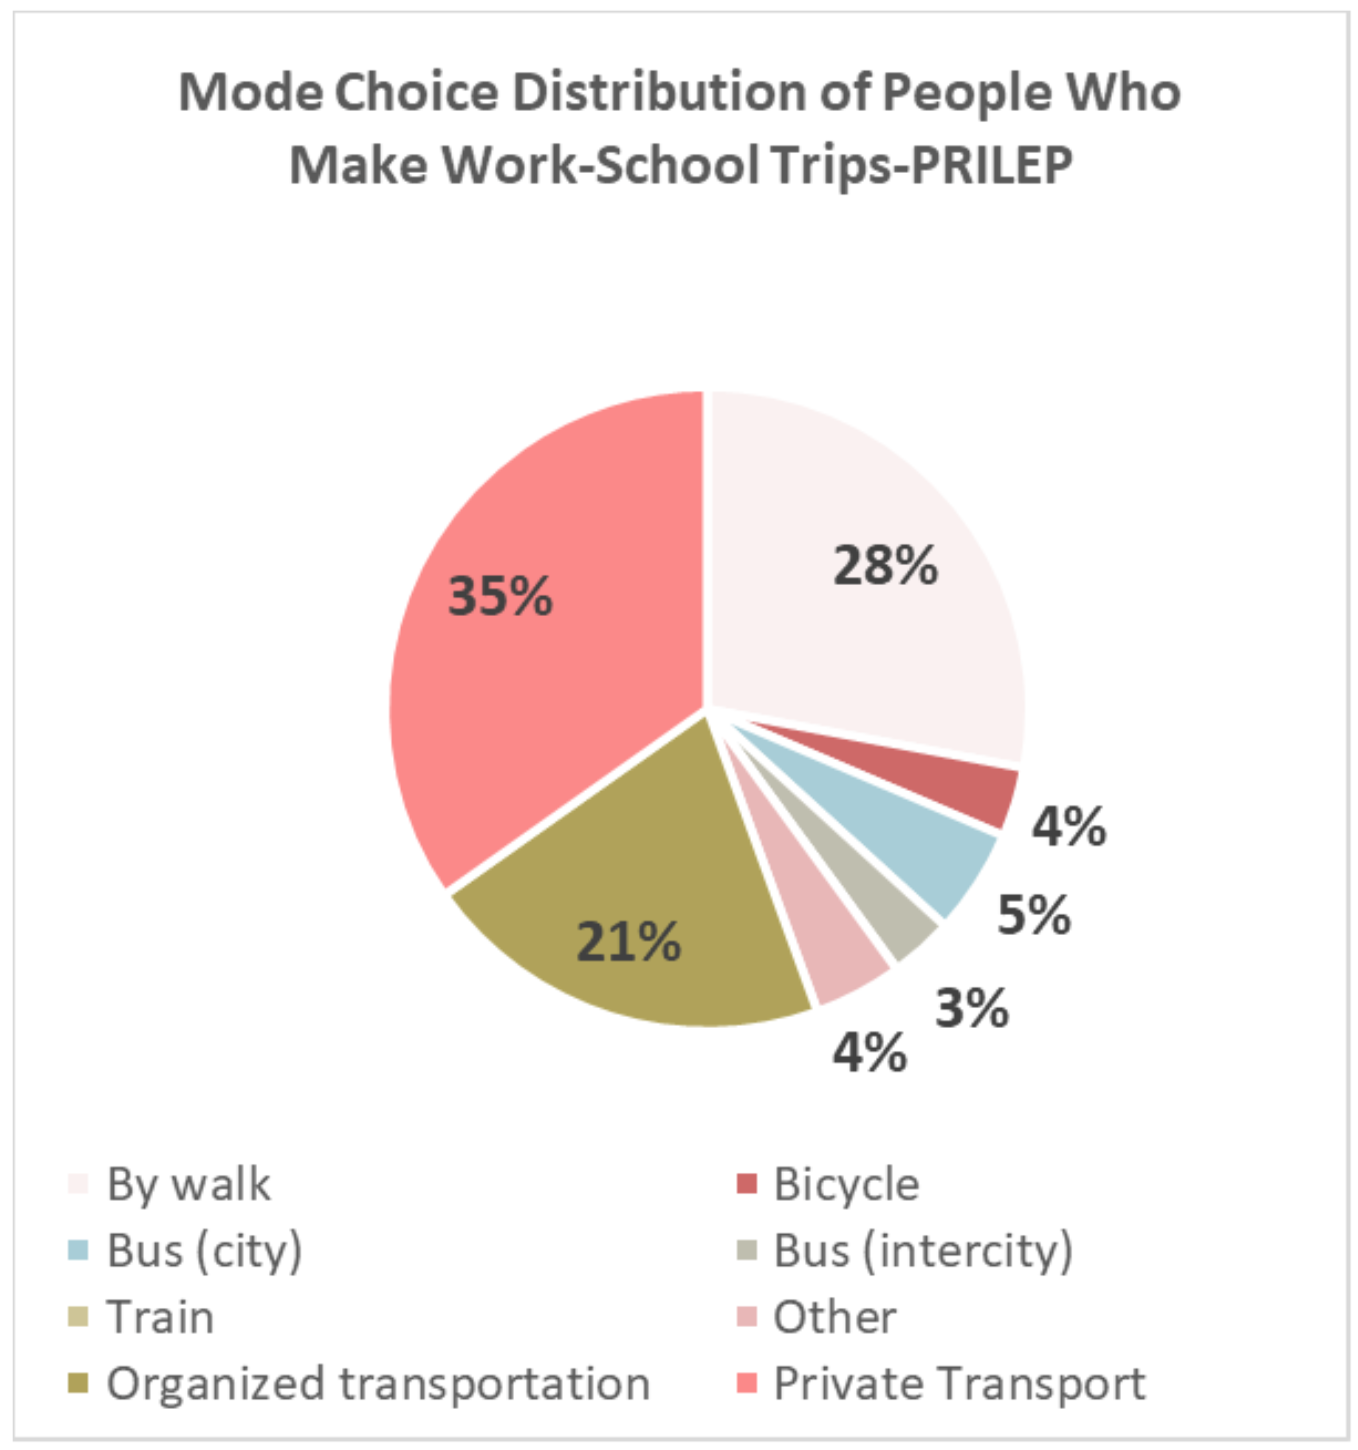
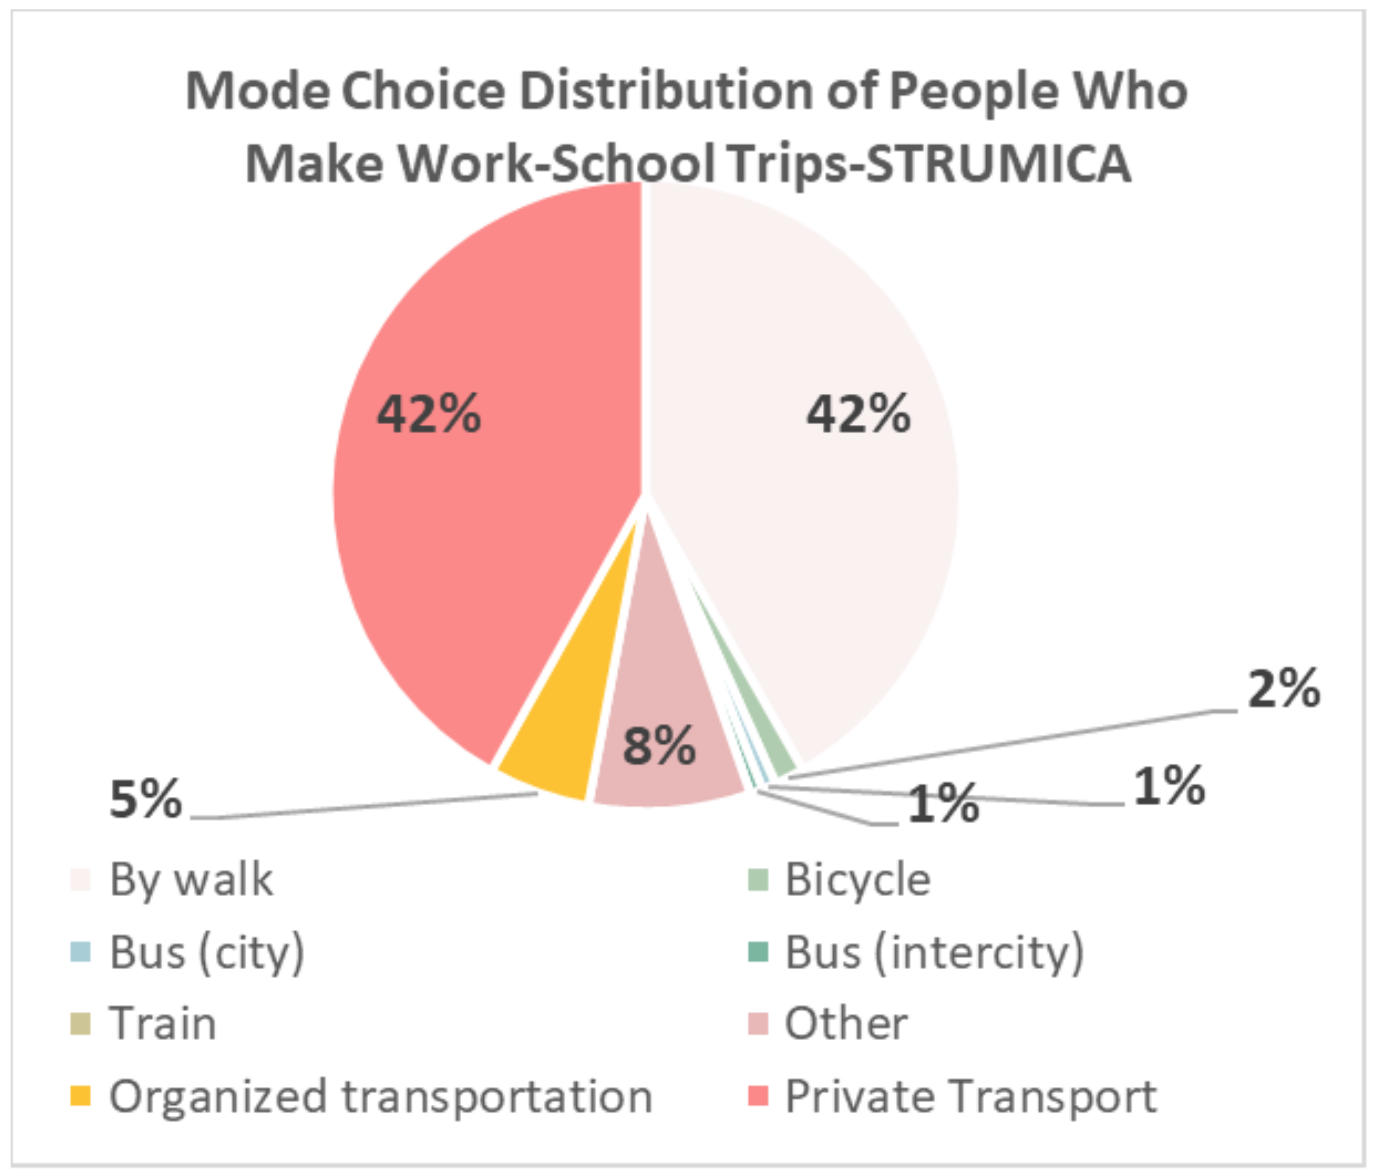
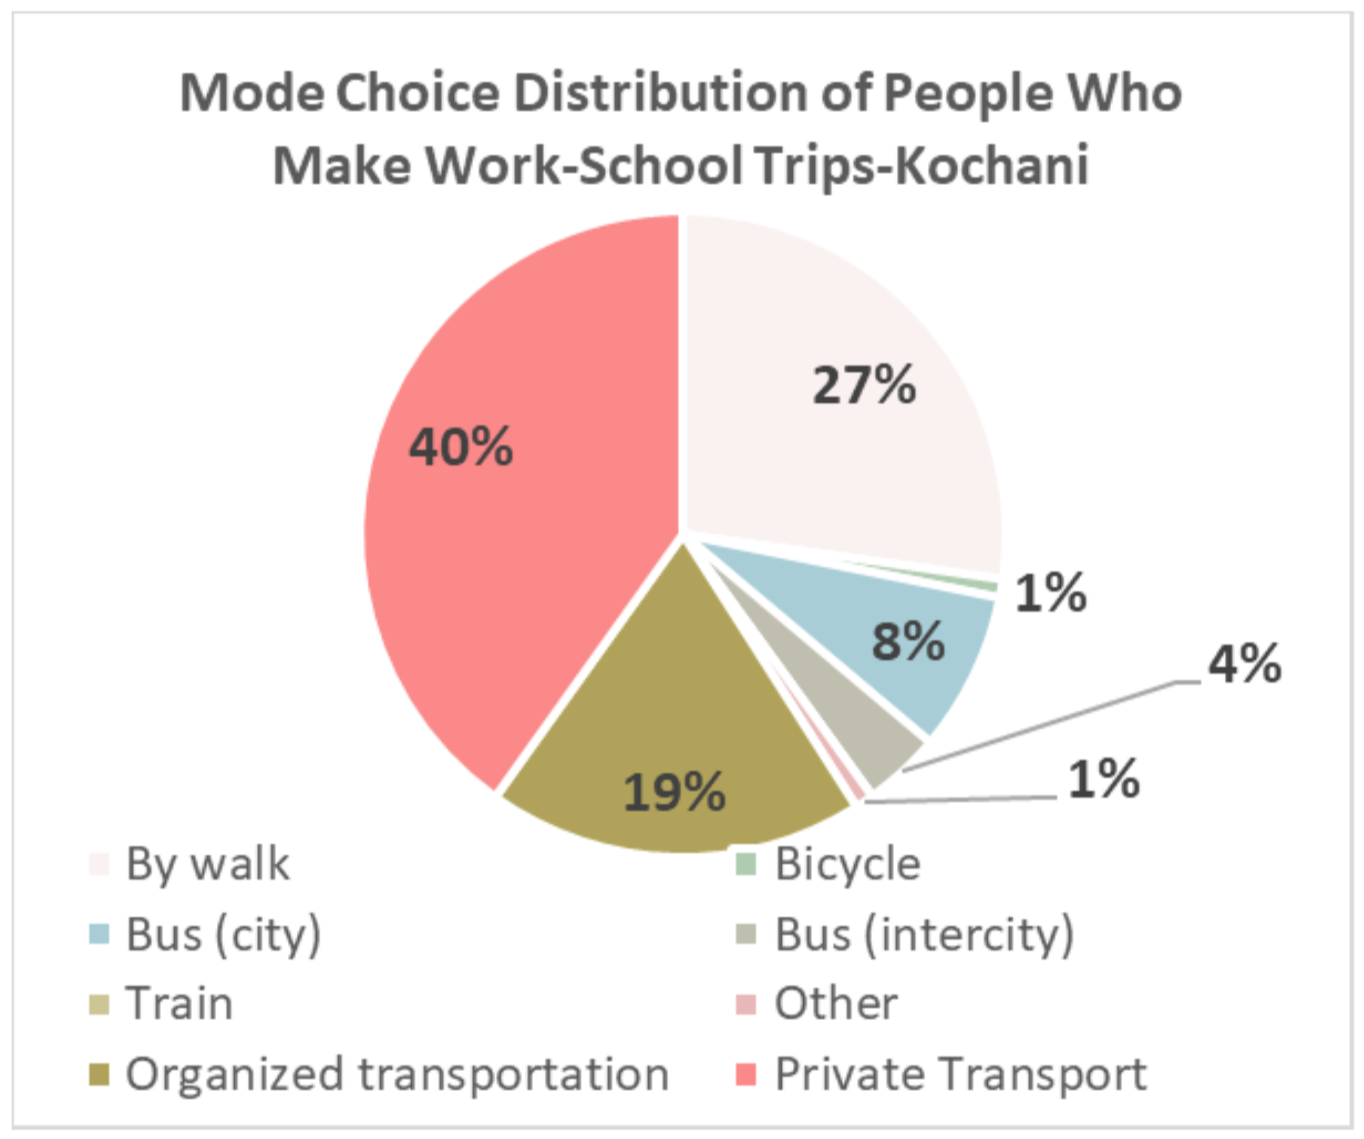
The modal split of the work and school trips are given in the graphs. Private car use and walk trips are the common modes for all the cities. Considering the scale of the cities it is normal that people walk to work and school. On the other hand, with relation of the non motorised systems and public transport systems, private car use is something to be taken under control with strategies and measures to create a shift from non-environmental friendly modes to sustainable modes.
1.3 Transport System Comparison
In the table below the motorization rates and network system comparison is given. As seen, Struga-Kocani are the ones with the highest motorization rate. Strumica is leading the bike and PT network.
Table 1. Transport Network System Comparison
| City | Motorization Rate | Bicycle Network | Public Transport Network |
|---|---|---|---|
| Kavadarci | 0.34 | 0 | 125 |
| Struga | 0.35 | 3.4 | *436 |
| Strumica | 0.29 | 8.2 | 172 |
| Kocani | 0.35 | 0 | 25 |
| Prilep | 0.27 | 5.9 | 56 |
*Including the sub-urban rural lines.
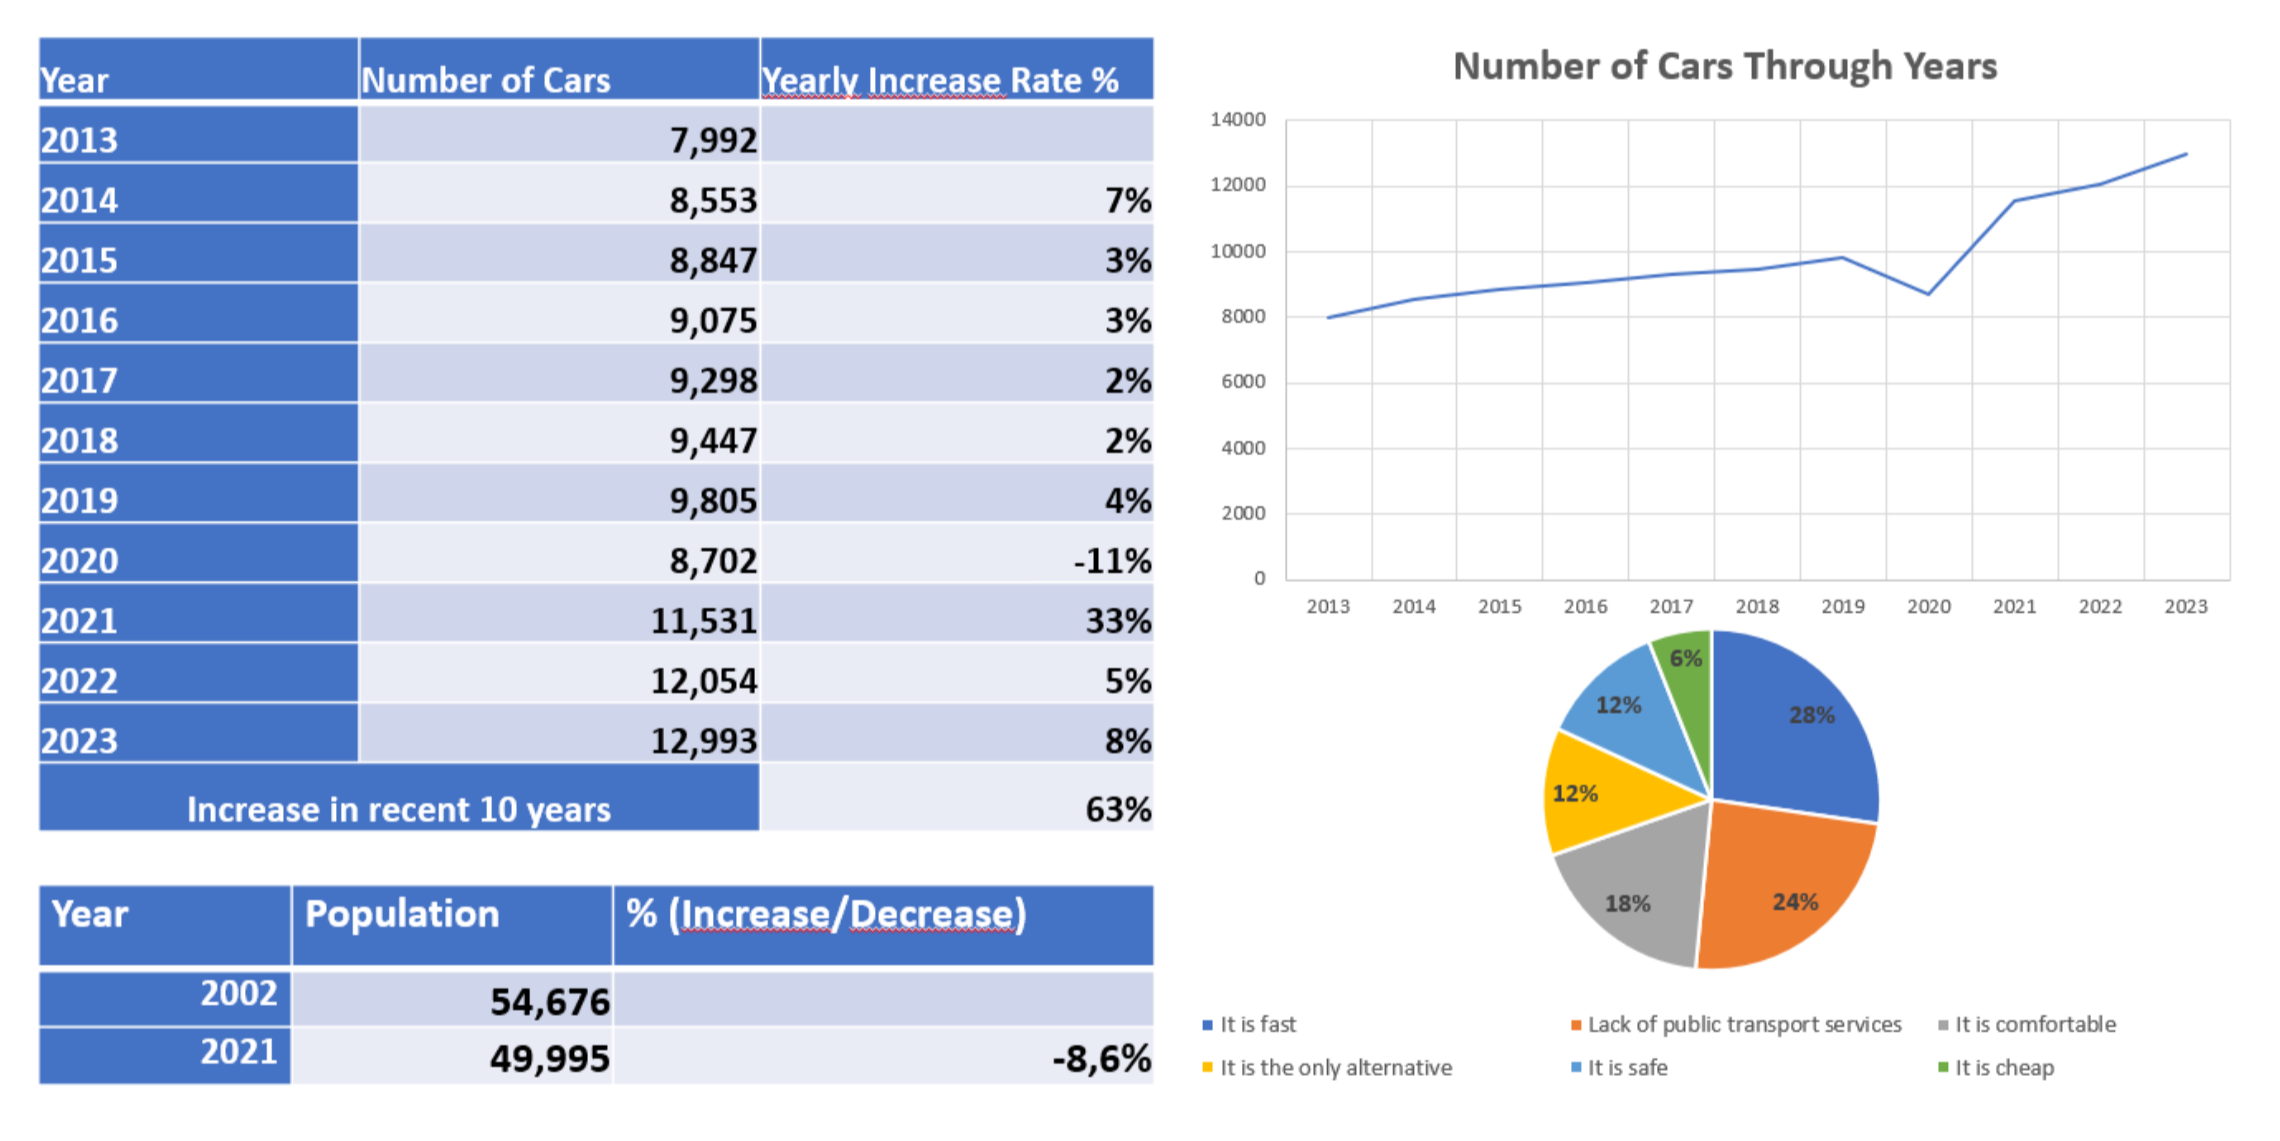
1.4 Registered Private Car Comparison
The general characteristics of the private car use in terms of sustainable urban mobility plans are listed below:
- Traffic Congestion – High volumes of private vehicles lead to frequent traffic jams and slower travel, especially during peak hours.
- Air Pollution and Emissions – Cars are a major source of air pollutants and greenhouse gases, contributing to climate change and negatively impacting public health.
- Energy Inefficiency – Private vehicles typically consume more energy per person than public transportation, relying heavily on non-renewable fossil fuels.
- Inefficient Land Use – Roads and parking areas for cars occupy large amounts of urban space, reducing land available for housing, green areas, and community facilities.
- Noise Pollution – The constant movement of cars increases noise levels in cities, affecting quality of life.
- Road Safety Issues – Greater numbers of cars raise the risk of accidents involving drivers, pedestrians, and cyclists.
- Social Inequality – Car-dependent urban design can marginalize people without access to private vehicles, limiting their mobility and access to essential services.
- Economic Costs – Managing congestion, maintaining road infrastructure, and addressing the health impacts of pollution all place a significant financial burden on cities.
In the figures below, it can be seen that population in all cities decreased while the number of private cars increase in very high percentages.
Strumica
Struga
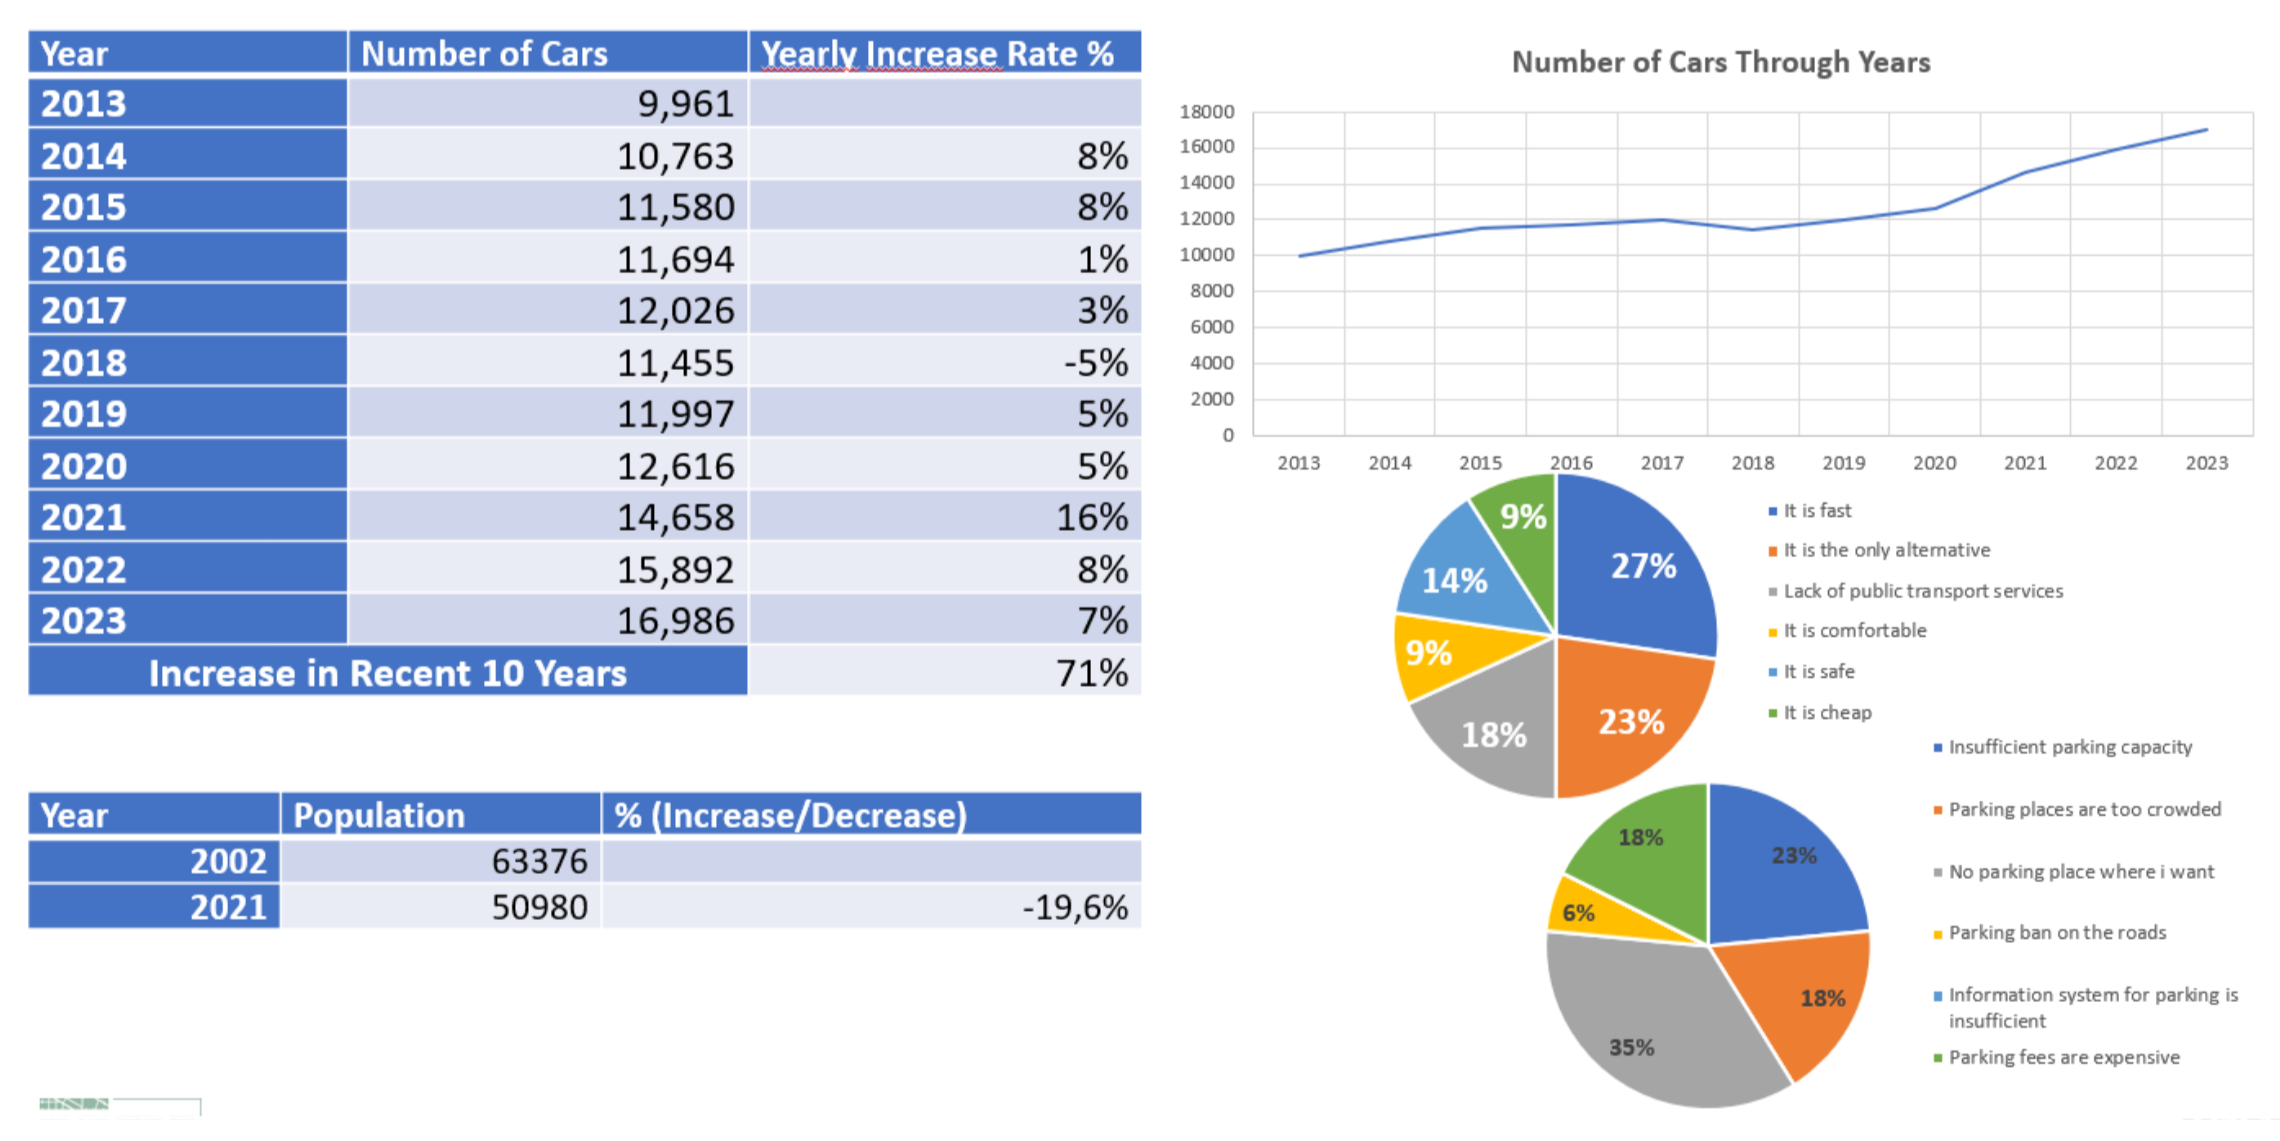
Prilep
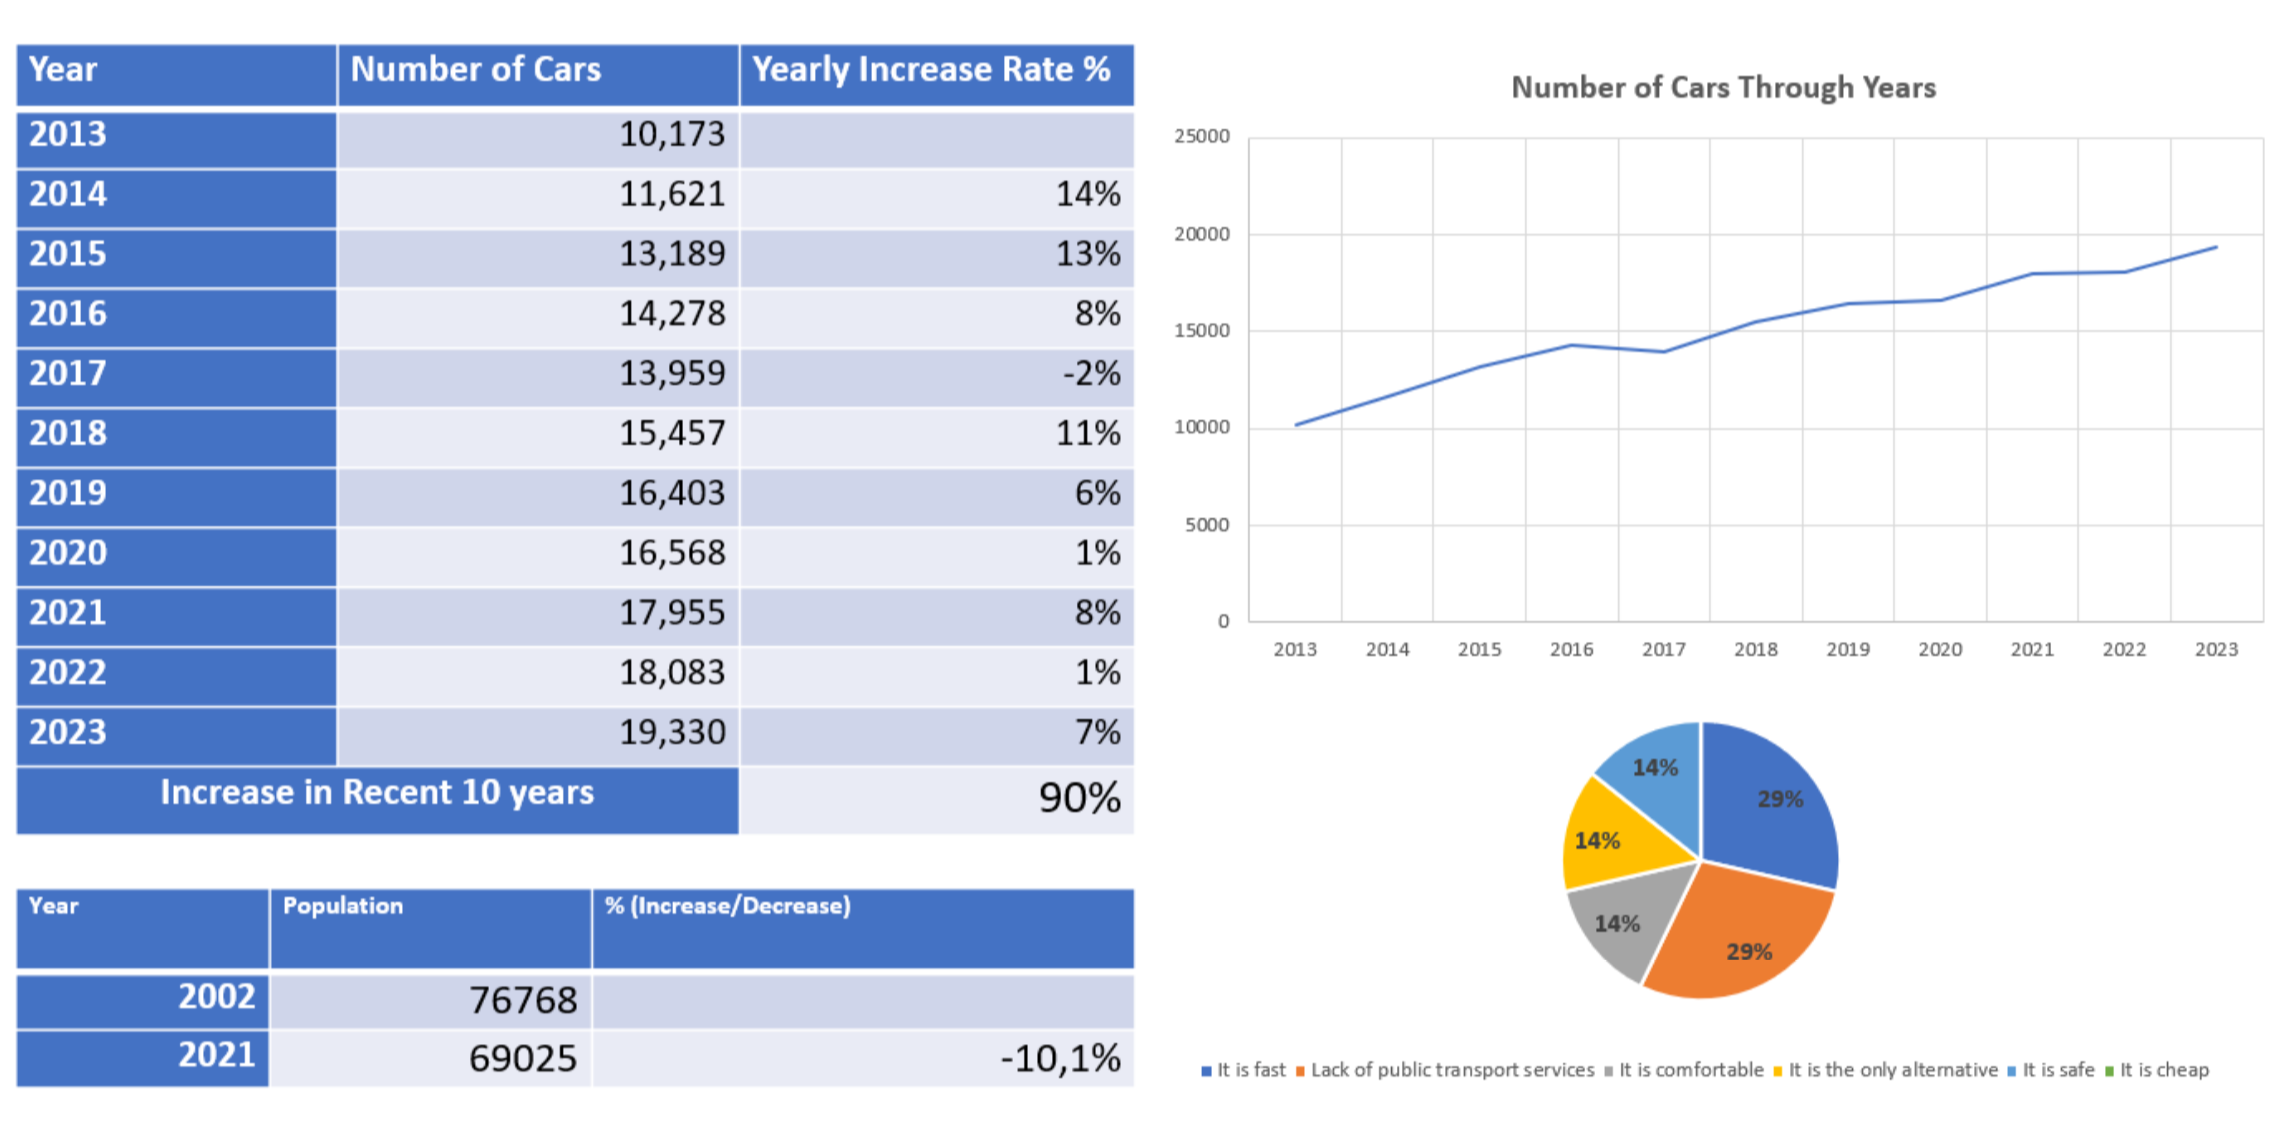
Kochani
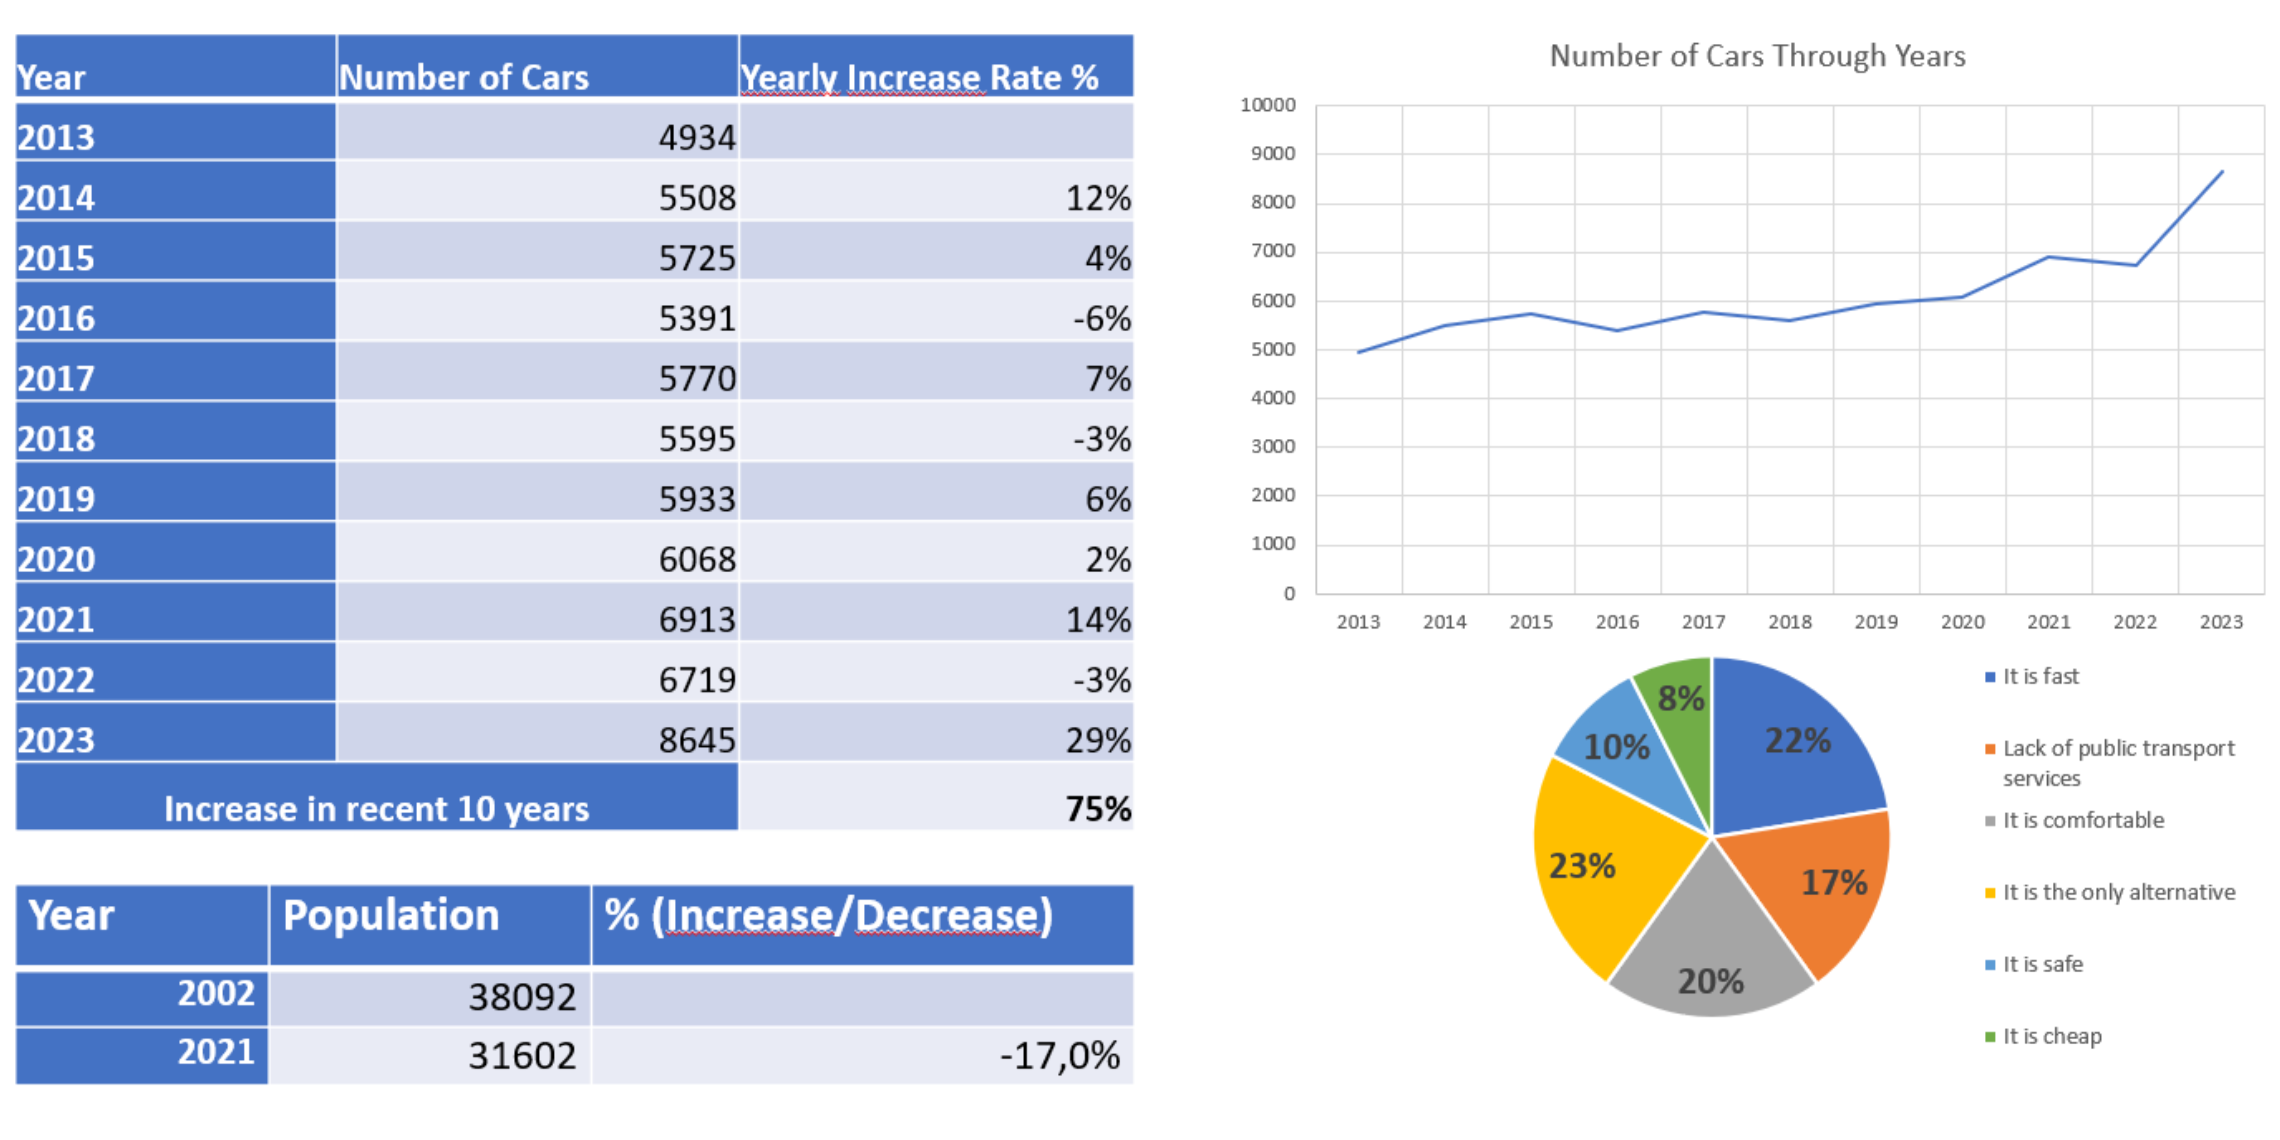
Kavadarci
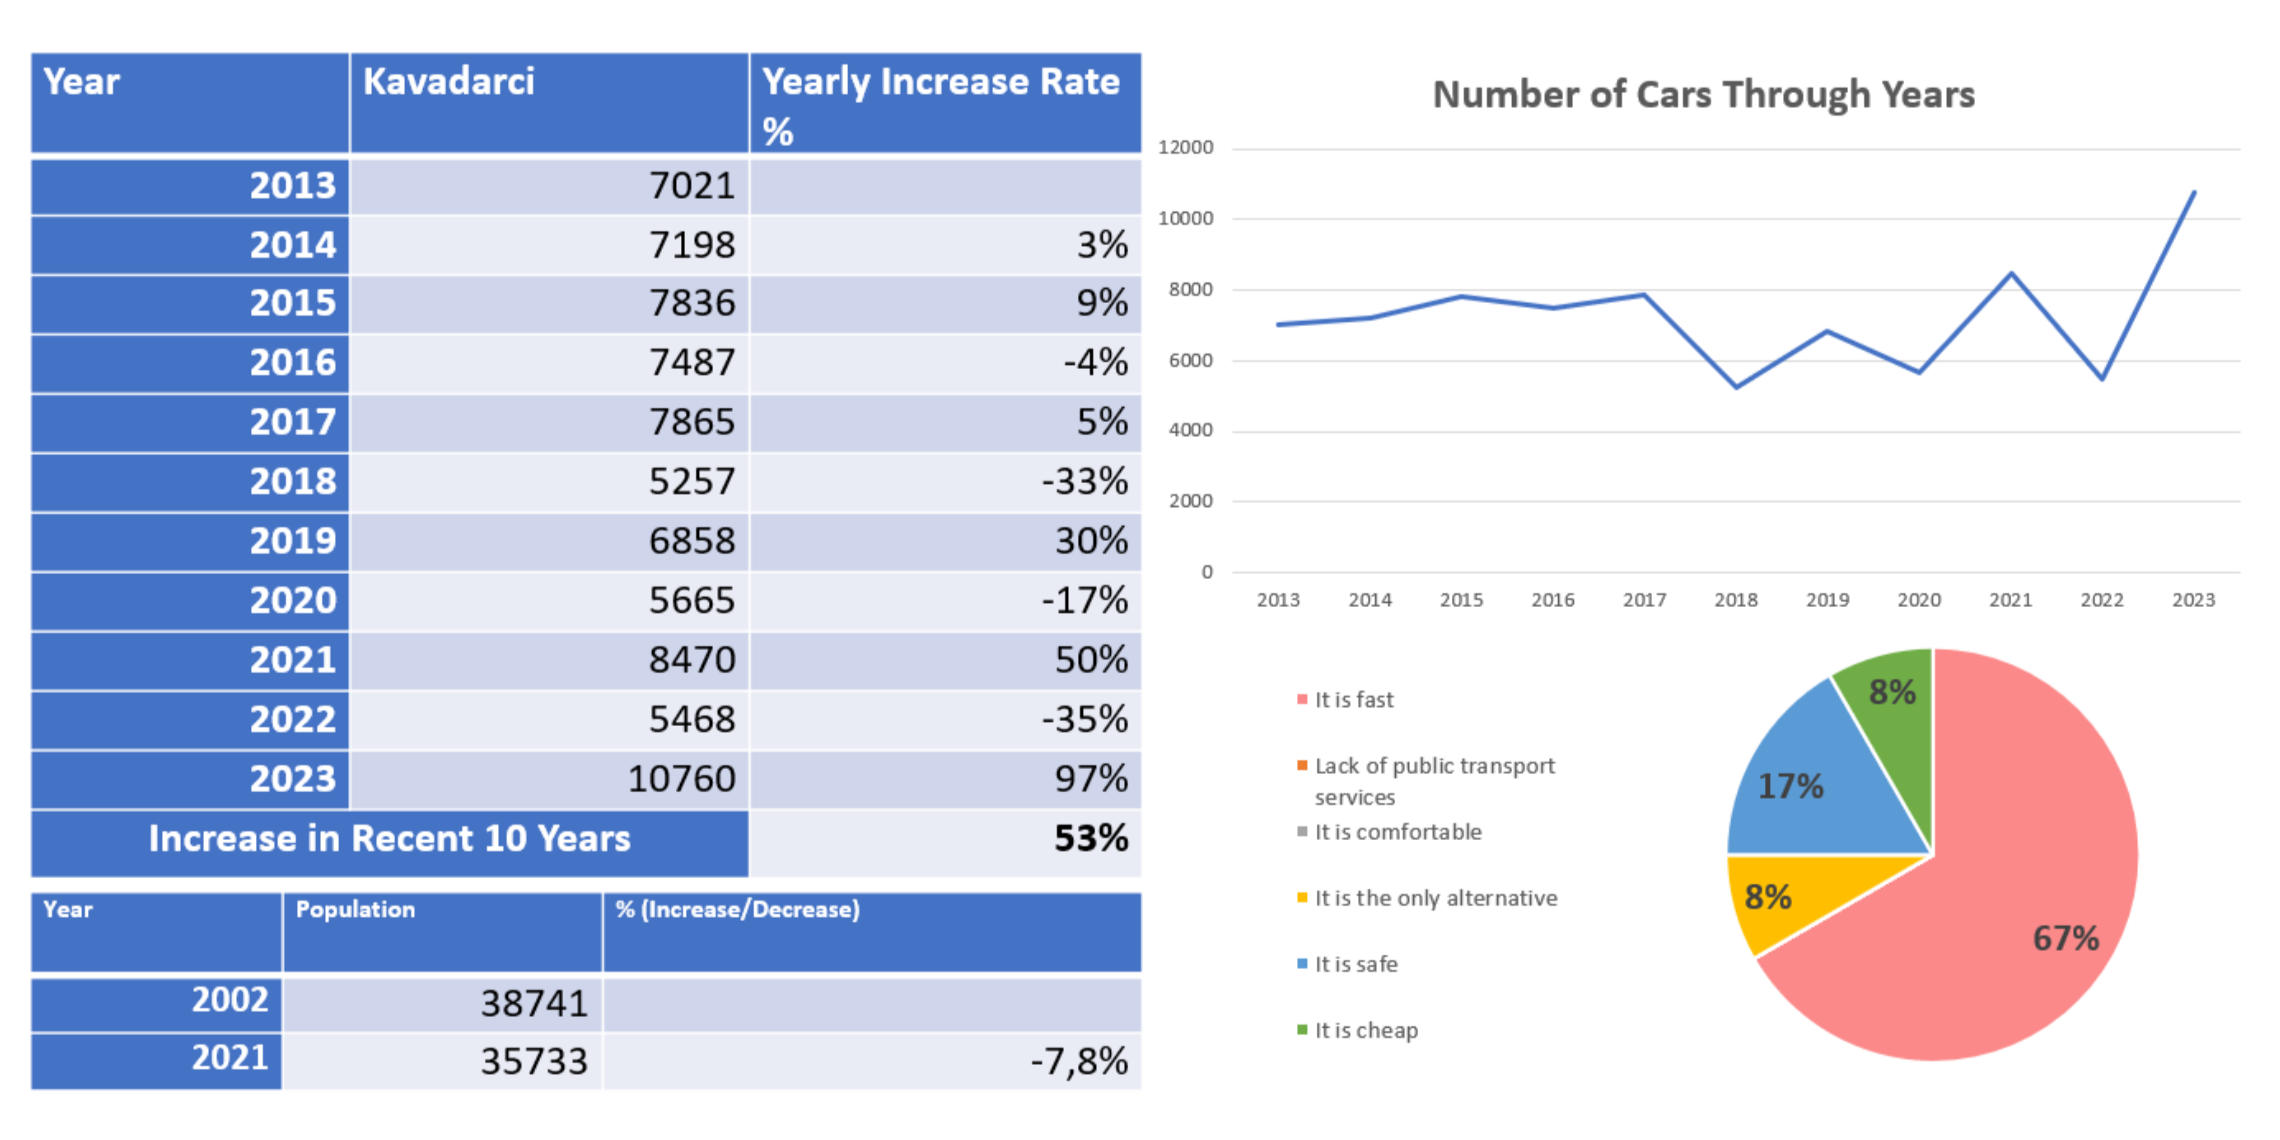
Source: MKSTAT Database